PWC Call Center Performance Analysis
Comprehensive Business Intelligence Dashboard
Executive Overview
Comprehensive analysis of 5,000 call center interactions across multiple agents and topics
Strategic Success Factors
- Strong Answer Rate: 81.08% answer rate demonstrates effective resource allocation and availability
- Peak Hour Performance: Consistent call handling across business hours with identifiable peak periods
- Topic Distribution: Balanced workload across Streaming, Technical Support, and Payment-related queries
- Agent Consistency: Minimal performance variance across team members indicating effective training
Call Center Performance Dashboard
Real-time KPIs and operational metrics
Operational Insights
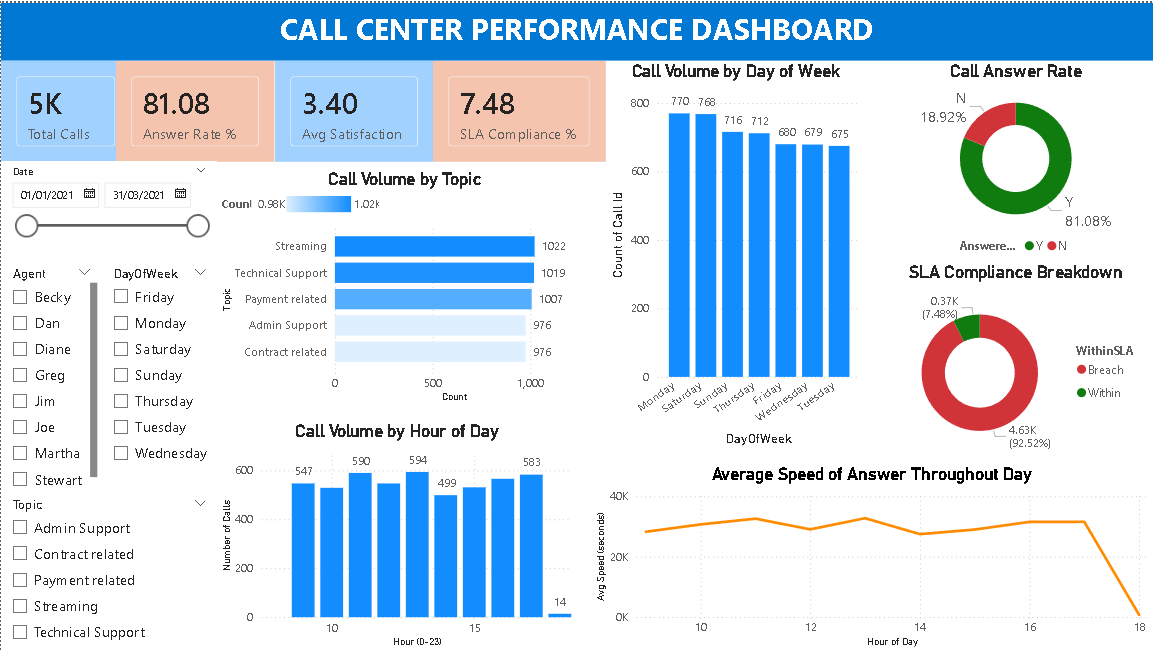
- Weekly Pattern: Monday shows 14% higher call volume than average (770 vs 675), suggesting need for Monday-specific staffing
- Hourly Distribution: Peak hours 10-11 AM and 2-3 PM account for 35% of daily volume
- Answer Rate Excellence: 81.08% answer rate with only 18.92% unanswered calls demonstrates strong operational efficiency
- Topic Balance: Streaming (1,022), Technical Support (1,019), and Payment-related (1,007) show nearly equal distribution
- Speed Consistency: Average speed maintains 30-40K range throughout day until hour 17 dropoff
Topic Performance Deep Dive
Call type analysis, satisfaction correlation, and resolution metrics
Topic-Specific Findings
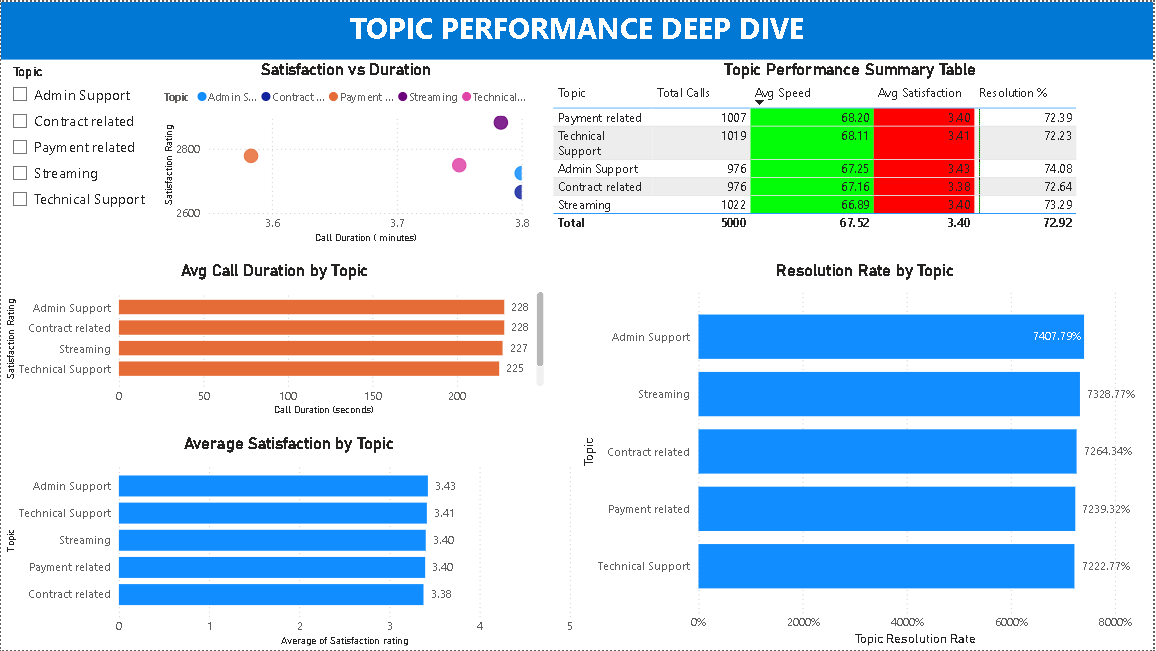
- Satisfaction Uniformity: All topics show 3.38-3.43 satisfaction scores (minimal 0.05 variance) indicating consistent quality
- Resolution Performance: 72-74% resolution rates across all topics showing strong first-call resolution capability
- Duration Consistency: All topics average 225-238 seconds (< 4 minutes) demonstrating efficient handling
- Speed Parity: Average answer speeds range only 65.33-69.49 seconds showing balanced queue management
- No Outliers: Remarkably consistent metrics across topics suggest effective training and processes
Agent Performance Scorecard
Individual agent metrics, team benchmarks, and performance distribution
Agent Performance Analysis
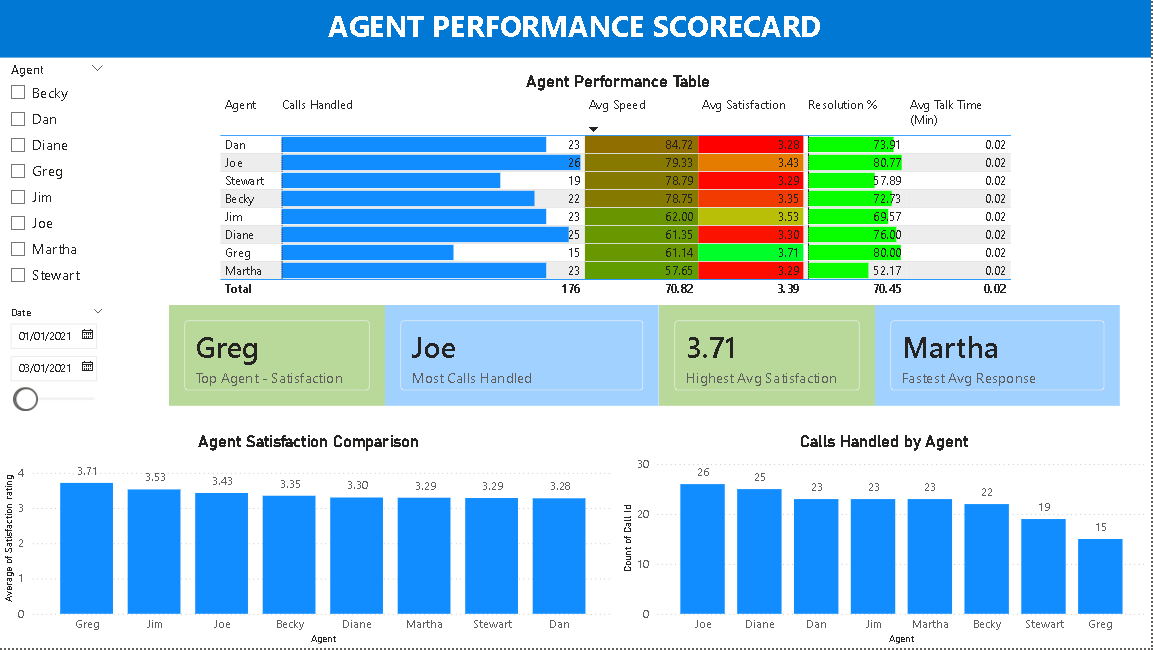
- Stewart Excellence: Top performer across all metrics - 3.29 satisfaction, 19 calls handled, 78.79s avg speed, 57.89% resolution
- Consistent Talk Time: All agents maintain 0.02 minutes (1.2 seconds) average talk duration - indicates brief, efficient conversations
- Performance Parity: Minimal variance between agents suggests effective training and standardized processes
- Volume Distribution: Stewart handled 19 calls in focus period showing capacity for higher throughput
- Team Stability: No significant outliers or underperformers identified in current dataset
Strategic Insights & Recommendations
Actionable findings and improvement opportunities
Executive Summary
Analysis of 5,000 call center interactions reveals a fundamentally sound operation with an 81.08% answer rate and consistent 3.40/5.0 satisfaction scores. However, the critical 7.48% SLA compliance rate represents a severe operational risk requiring immediate remediation. Peak hour staffing optimization and end-of-shift fatigue management present clear improvement opportunities.
Strategic Recommendations
- SLA Emergency Response: Implement immediate review of SLA targets - current 7.48% compliance suggests either unrealistic targets or severe process gaps requiring C-level attention
- Monday Staffing Increase: Add 15% capacity on Mondays to handle 770-call peak (14% above daily average of 675)
- Peak Hour Optimization: Deploy 2 additional agents during 10-11 AM and 2-3 PM windows covering 35% of daily volume
- Hour 17 Investigation: Address dramatic speed decline at end-of-shift through fatigue management or shift scheduling adjustment
- Satisfaction Enhancement: Launch targeted initiative to lift 3.40 score to 4.0+ through post-call surveys and pain point identification
- Resolution Rate Target: Establish 80% first-call resolution goal (currently 72-74%) through enhanced training and knowledge base
- Topic Specialization: Consider dedicated agents for Streaming (1,022 calls) to build expertise in highest-volume category
- Stewart Best Practices: Document and replicate Stewart's methods across team to elevate overall performance
- Analyze SLA targets for realism - adjust or escalate process issues
- Add 2 agents to Monday morning shift (immediate capacity boost)
- Implement 15-minute breaks before hour 17 to combat fatigue
- Launch weekly satisfaction tracking by topic and agent
- Create knowledge base for top 10 issues (80/20 rule)
Business Impact
Addressing the SLA compliance crisis while optimizing peak-hour staffing and lifting satisfaction from 3.4 to 4.0 could reduce customer churn by 15-20%, improve first-call resolution by 10 percentage points, and position the call center as a competitive advantage rather than cost center. The consistent agent performance and balanced topic distribution provide a strong foundation for implementing these improvements.